Headquarters EnergyCAP, LLC
360 Discovery Drive
Boalsburg, PA 16827

Denver, CO
Suite 500
5445 DTC Parkway
Greenwood Village, CO 80111

Dublin, Ireland
Unit F, The Digital Court, Rainsford Street,
Dublin 8, D08 R2YP, Ireland

Phone: 877.327.3702
Fax: 719.623.0577

Energy heatmap analysis

Heatmap visualizations help you quickly evaluate patterns of power consumption and peak load demand changes in your operation. Calculate potential savings and model new consumption schedules for potential savings.

Energy heatmaps identify waste in operations

An activity map is a heatmap of the energy usage for a selected datapoint—like an area of a building, HVAC system, or piece of equipment. Activity maps help you identify savings opportunities at a glance with an intuitive, holistic overview of how much, or how little, energy is being consumed over time.

Use activity maps to perform operations wastage analysis and identify times when energy usage is high, but return on that investment is low—like when no one is present in the building or equipment doesn’t need to be running. Making changes can save substantial cost, energy usage, and GHG emissions while minimally impacting the effective use of a space.

Quickly identify operational inefficiencies

Heatmap visualizations provide immediate visual clarity, allowing energy managers to quickly identify patterns in power consumption. Instead of laboriously analyzing rows of numerical data in spreadsheets, heatmaps use color to represent varying levels of energy usage, making it easy to spot trends, peak periods, and anomalies. This visual approach saves time and enables managers to focus on key areas that need attention, facilitating quicker and more effective decision-making.

Be confident in your energy projects and priorities

With heatmaps, energy managers can make informed, data-driven decisions to optimize operations. By clearly highlighting when and where energy usage is highest, managers can proactively implement strategies to balance loads and reduce peak demand. This capability supports more strategic planning and operational adjustments, ensuring that energy management initiatives are both efficient and effective.

Identify peak load periods and save money

Heatmaps are instrumental in identifying peak load periods, allowing energy managers to implement targeted interventions that can shift or reduce load during these times. By avoiding high peak demand charges and optimizing consumption schedules, significant cost savings can be realized. Heatmaps provide a clear visual basis for these adjustments, making it easier to plan and execute cost-saving measures.

Find the faults and avoid the halts

Using heatmaps, energy managers can swiftly detect anomalies or irregularities in energy consumption, such as unexpected spikes that might indicate faulty equipment or energy wastage. This rapid identification allows for timely investigation and resolution, enhancing overall operational efficiency. Additionally, understanding consumption patterns helps allocate resources more effectively, further streamlining operations.

Activity maps power savings across industries

Industries with fluctuating energy demands can significantly benefit from operations wastage analysis.

  • Manufacturers can optimize scheduling and equipment runs.
  • Healthcare facilities, educational institutions, government  campuses, businesses, and hotels rely on activity maps to analyze consumption across departments and building areas. 
  • Retailers leverage activity maps to understand energy use based on customer foot traffic patterns. 

Activity maps make valuable insights into streamlined operations and substantial cost savings available to every organization across every industry.

Unlock EnergyCAP’s best features with activity maps

Activity maps hold the key to several of the most popular, and effective, energy saving features within EnergyCAP SmartAnalytics. Model your energy saving projects and calculate exactly how much energy, cost, and GHG emissions will be saved using activity maps in the Operations Analyzer. Let activity maps guide energy reduction project tracking in the M&V module. 

The EUI trend chart plots all energy commodities for a building or organization (excluding water, refuse, etc.), and provides a rolling 12-month average trendline where each data point is the sum of global use for the prior 12 months divided by the maximum floor area in the same 12 month period. Customizing the data you see on the chart is a click away.

Decoding energy waste analysis

Heatmaps provide an hour-by-hour view of your energy usage data over the course of an entire month, uniquely providing both a bird’s eye view and to-the-minute details of your consumption. Energy activity maps clearly visualize energy use and equipment behavior patterns, including outliers and unnecessary activities. Immediately see circumstances like

  • When someone has forgotten to switch off equipment after hours (dark green peak consumption overnight)
  • Machines that are needlessly running 24/7 (light green color overnight should be white to indicate no consumption).
  • HVAC and light fixtures that can be lowered during periods of low occupancy, like weekends and evenings (change dark green consumption to light green overnight).

Small tweaks make a big difference

Visualizing operational activities alongside energy consumption guides you to the exact changes to make to see lower utility bills. Easily set the schedule of when to switch off a piece of equipment or group of appliances, adjust HVAC schedules, consolidate when groups of equipment are running, and target adjustments to lighting and ventilation during off-peak hours.

One hotel using EnergyCAP identified savings of over 7% in monthly restaurant energy costs just by turning off kitchen equipment and adjusting heating/cooling for a few hours overnight—small changes have big impacts!

Energy managers love heatmaps!

Energy managers love EnergyCAP heatmaps because they provide clear, visual insights into energy usage patterns, allowing for quick identification of inefficiencies and opportunities for cost savings.

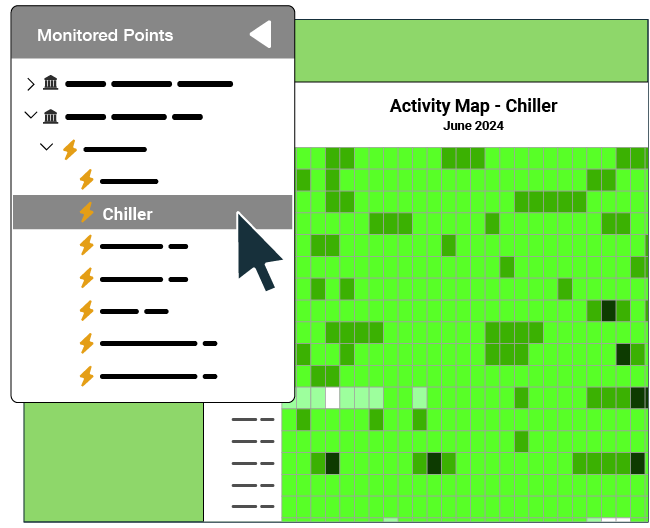
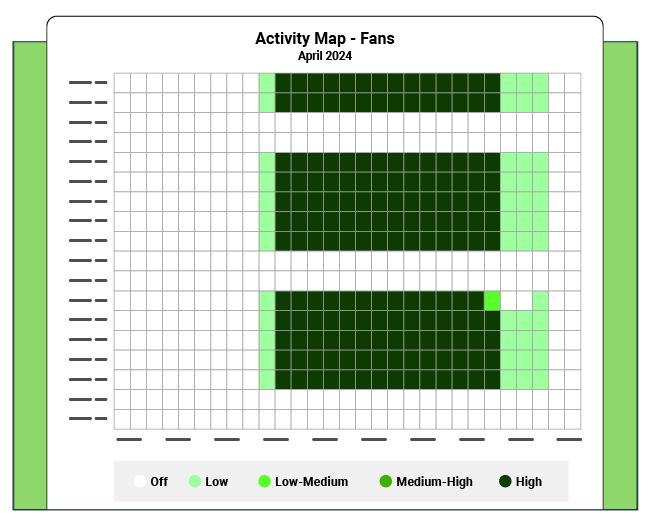
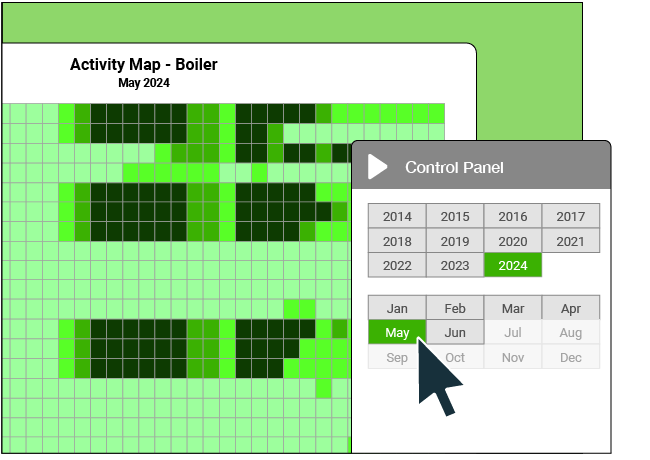
"EnergyCAP Smart Analytics (Wattics) helped me immensely in energy-saving by identifying hidden areas. The technology is unique in what it can do and can find out when HVAC plant is on & off, which...
John Corroon // Jurys Inn
"Intuitive software, highly responsive team. Getting setup in and using [EnergyCAP SmartAnalytics] had a very short learning curve.
Grace Junge // Edison Energy
"The software is built with do-it-yourself functionality, which has been great for our team—we are able to easily add/remove/reconfigure meters based on our frequently changing needs."
Grace Junge // Edison Energy
"Top user experience. Our customers are pleased with the advanced, automated IPMVP project management tools that provide high value for our ESCO partners in energy efficiency and saving projects."
Howard Wang // Accuenergy
"It is compatible with a wide range of (existing) hardware and this makes it easy to install and get up and running."
Cas de Roij // Klictix
“EnergyCAP software is an extremely user friendly and reliable system. I have been managing this system for 17 years through various versions of the system. With every version or release of the...
Fara M.

Explore other EnergyCAP SmartAnalytics features

The single source of truth for your energy and sustainability data.

Request a Demo
Recommended resources for you