Headquarters EnergyCAP, LLC
360 Discovery Drive
Boalsburg, PA 16827

Denver, CO
Suite 500
5445 DTC Parkway
Greenwood Village, CO 80111

Dublin, Ireland
Unit F, The Digital Court, Rainsford Street,
Dublin 8, D08 R2YP, Ireland

Phone: 877.327.3702
Fax: 719.623.0577

Energy management and utility dashboards

EnergyCAP UtilityManagement’s dashboards make energy and utility data analysis easy and convenient by providing visual insight into your utility bill data. Energy management dashboards display all of the energy and sustainability data you choose in one place. They’re customizable, easy to create, and simple to share.

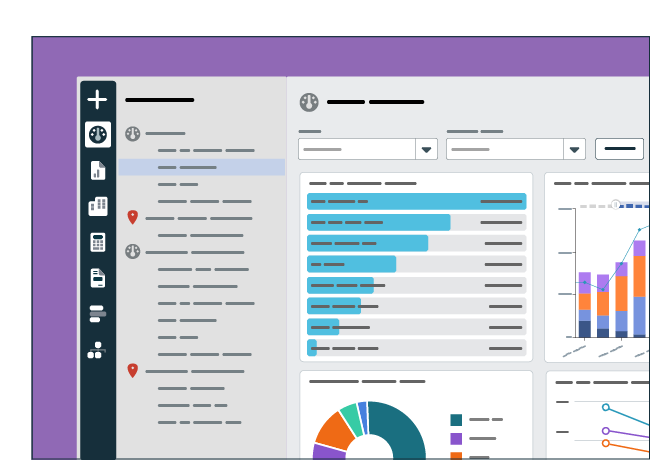
Visualize savings with best-in-class energy and utility dashboards

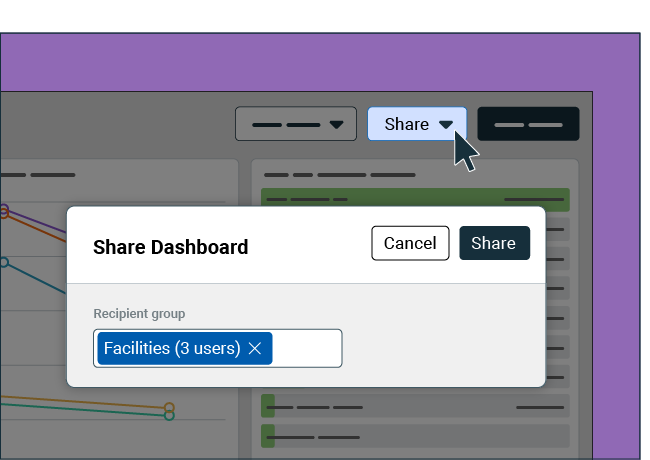
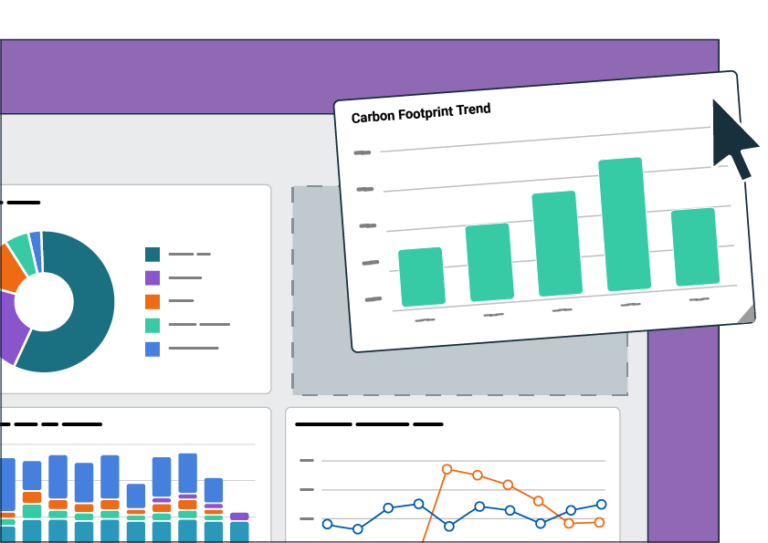
Build an unlimited number of dashboards, then populate each one with customized performance charts, graphs, tables, KPI’s, and visuals. Create a personal dashboard to quickly see the utility data you need, or build dashboards to share within your organization or externally through a public link or by embedding a dashboard in a webpage.

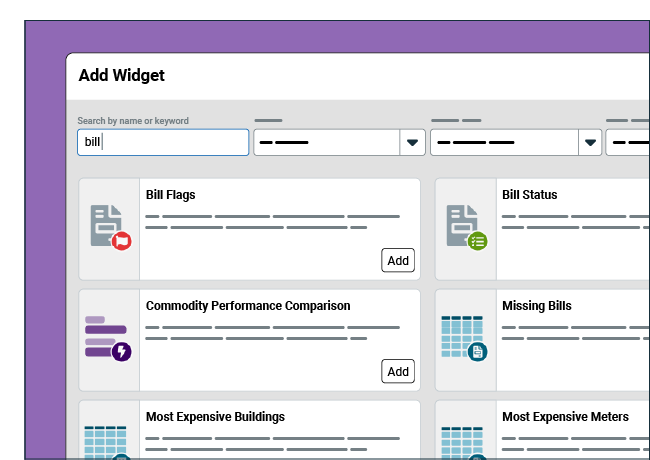
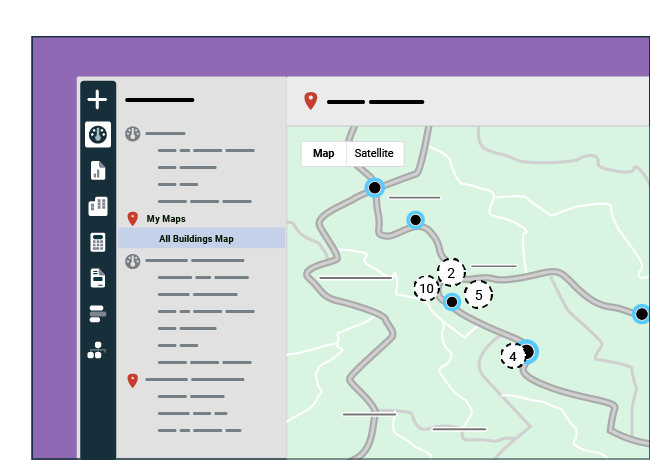
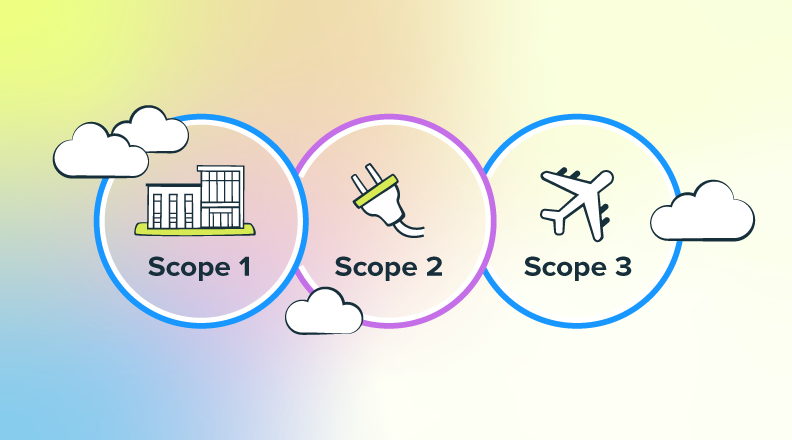
Each visual shown on a dashboard is built through a widget. The comprehensive widget library covers a range of categories including accounting, energy management, sustainability, and facility management. A flexible text widget lets you add text and images using HTML. Add and arrange widgets to create a custom energy use, cost, savings, benchmarking, GHG, interval data, or utility dashboard, or create a map-based dashboard to quickly view facility performance statistics.

Reporting is a data maze without EnergyCAP UtilityManagement dashboards

Without customizable energy management dashboards, you’re stuck wading through spreadsheets and reports to find a single energy and sustainability datapoint. Decision making becomes cumbersome without a customized, holistic view of your facilities data all in one place. Energy management dashboards can be shared instantly—without them, communicating progress to internal and external stakeholders is an inconvenient, manual process of cobbling together data, creating visuals, and remembering to send out communications.

See it all at a glance with customizable energy dashboards

Ditch the data maze! Why waste time clicking through endless screens or files to find what you need? Build your own, personalized energy and sustainability data dashboard or create dashboards for your entire organization to see. Use the comprehensive library of customizable visual widgets to see exactly the information you want, all in one place. Add other relevant visuals to create a comprehensive, customized report that keeps you informed at a glance.

  • Create unlimited customized dashboards 
  • Instantly share critical data within your organization
  • Share progress with stakeholders or the public
  • Make fast, data-driven decisions
  • See the facilities data you need at a glance

Customized data on demand with energy and utility dashboards

EnergyCAP UtilityManagement’s dashboards provide visual insight into your data, displaying key information from your utility bill, sustainability, and facilities data. Create and customize dashboards for yourself, your organization, or external stakeholders and the public. EnergyCAP UtilityManagement dashboards are:

  • Flexible and completely customizable
  • Integrated with EnergyCAP SmartAnalytics to see your real-time data
  • Easy to share externally through links or embedded into a website
  • Unique—see your data through charts and graphs, or on a map to compare parameters by location
  • Easy to manage, duplicate, customize, and share

Accurate energy data, visualized.

EnergyCAP UtilityManagement serves as your single source of energy data truth, with dashboards as the tool for energy managers, sustainability, and finance leaders to slice-and-dice that data for what’s most important to them, create visual-rich, personalized dashboards to be viewed on-demand, or build dashboards designed for cross-functional collaboration and to be viewed by the public.

Dashboards are completely customizable through widgets—the options are endless. Users can create dashboards to highlight building operations, summarize energy usage at the building or portfolio level, visualize GHG emissions, manage utility bill accounting, or compare building cost or energy usage across a map.

Energy & sustainability leaders love our dashboards

Our energy and sustainability ERP brings cross-functional teams together, in a single platform, to drive cost-effective and responsible utilization of finite resources.

“EnergyCAP enabled us to identify our worst performing buildings in terms of energy use intensity, and we have been able to see and track our progress in this very transparent platform.”
Jeff W.
"Not only has EnergyCAP saved us time and made us more productive in tracking our energy costs, but we have been able to identify misapplied payments, ensure that when facilities move the utilities...
Lisa Roberts // Manager, Engineering Administration
"I think that it is clear that our Office would not function well or efficiently without [EnergyCAP]."
Emily Hunter Soontornsaratool // Energy Data Program Manager
"I have been very impressed with how intuitive the software is, the ability to determine how much power you can save, based on historical data, before starting a project adds a huge amount of value!"
Brendan Gunn // Fresh Energy
"I think that it is clear that our Office would not function well or efficiently without [EnergyCAP]."
Emily Hunter Soontornsaratool // Energy Data Program Manager
logo-iowa
"The chargeback piece of this application is probably the main thing that drew us to a standardized solution and especially to EnergyCAP. We have pretty much every imaginable billing scenario I think...
George Paterson, Energy Control Manager

Explore other UtilityManagement features

The single source of truth for your energy and sustainability data.

Request a Demo
Recommended resources for you