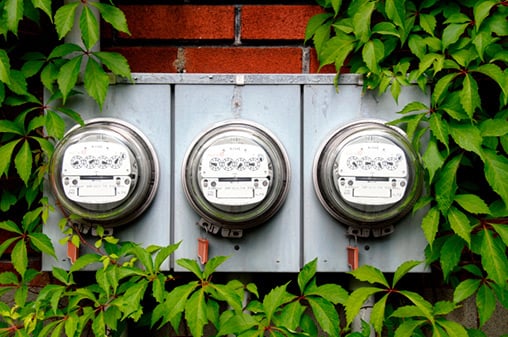
They’re present in or on nearly every building you visit, tracking every drop of water, every stray kilowatt, every wisp of natural gas. They’re on duty 24-7, and the information they carry is vital to your organization’s bottom line. Ideal workers, they never complain, seldom need attention, and perform with near flawless precision. In fact, they’re so reliable that it’s easy to take them for granted. But our advice is: Don’t Miss Your Meters.
 We’re talking about your commodity meters here. Those silent sentinels that quietly gather the consumption data that drives your sustainability and efficiency efforts and helps determine your success or failure.
Here at EnergyCAP, we don’t want you to miss your meters—and the vital information they contribute to your energy management program. And although our software product never makes a physical connection with your meters, here’s how we make sure that your meter data is front and center when it comes to energy analysis and energy savings.
Meter-Level Use and Cost
EnergyCAP energy management software uses utility bill data from your utility vendor to track any commodity, level and type of bill detail in EnergyCAP. That includes any consumption information included on the bill. That consumption data is then featured in our TreeView navigation, which is based on buildings and the meters they contain. This makes it easy to look at the big-picture consumption for your organization and then “drill down” through departments and divisions to zoom in on the energy use and cost associated with a single meter.
EnergyCAP can track both standard and deregulated bills (separate LDC/supplier charges), giving you the granularity you need to understand your energy use and spot savings opportunities.
You can view each meter’s cost and consumption history in tabular or graphical formats, and easily compare fiscal year use/cost or monthly trends.
Unit System Editor
EnergyCAP’s Unit System provides a table of equivalencies that enables EnergyCAP to convert between various energy types, units and commodities. By relating and harmonizing utility billing data from diverse sources and vendors, and reporting on that data using user-selected energy “Roll-Up units” such as MMBTUs, EnergyCAP is able to provide meaningful energy information across the enterprise.
The Unit System Editor interface enables the software user to define the components needed to store utility billing data in EnergyCAP Enterprise. Components that may be created, defined and incorporated in the Unit System Editor include:
Commodities
Defines the goods, services, or other entities that are being monitored by EnergyCAP Enterprise. Examples include electricity and natural gas, but can also include less traditional categories like wood or weather.
Types
Defines a type of observation monitored for a commodity and provides the context for that data’s usage. Example types include use, percentage and demand, but may also include taxes and cost.
Units
Defines the units of measure for all commodities. You can also define conversions between units of like types (e.g., converting cubic feet to gallons) by supplying the equation to use for the conversion.
Equivalencies
Defines relationships between commodities, types, and units.
Submeters
EnergyCAP has multiple methods for integrating submeter data into your reports and internal billing processes. Every time you install a new submeter, you can enhance the granularity and the value of EnergyCAP’s analysis tools.
Calculated Accounts can be set up and used to calculate bills for actual submeters for chargeback or re-billing purposes. The Calculated Account bills generated by EnergyCAP can track use, demand and cost.
An example is a campus situation where a “Master” account or meter serves multiple places. Each location has a submeter installed to track the consumption. Meter readings are taken on a monthly basis. Bills need to be generated for each location because the cost center (such as an agency or tenant) is charged for the commodity consumed.
Monthly meter readings are used to determine the commodity quantity for the bill. The bill cost can either be based on the Average Unit Cost (AUC) of a “Master” account/meter, or on the results of an EnergyCAP rate schedule calculation.
Meter-by-Meter Budgets & Forecasts
EnergyCAP’s meter-based database enables you to create detailed meter-by-meter and month-by-month budgets based on historical bills. Much less “guesstimating” is required when formulating your annual energy budget! EnergyCAP’s Budgets & Forecasts module helps users create meter-by-meter, building-by-building granular budgets that can be rolled up for any level of the organization, modified, and used for reporting. Up to three years of historical utility billing data can be used to help generate each budget.
You can create any number of budgets (actual, best case, worst case) based on historical bills. Then forecast expected costs, usage, and unit costs. Each budget can be edited as the year plays out. And you can easily update expected usage or unit costs if rates increase or other conditions change.
Interval (Time-Series) Data Import
Just because EnergyCAP doesn’t directly interface with your metering system(s) doesn’t mean we don’t care what your meters have to say! If you have smart meters or other interval data collection devices, you can import flat file interval data (usually 15, 30, or 60-minute intervals) into EnergyCAP for detailed energy consumption analysis.
There are multiple options in EnergyCAP for charting, auditing, aggregating and analyzing interval data, including non-standard channels such as KVAR and power factor. You can also import non-metered time-series data including production volume, occupancy, or weather conditions. EnergyCAP software is flexible enough to associate these external factors with energy use to calculate, for example, energy used per hotel room stay, or energy consumed per manufactured widget.
Meter Data Import
As noted above, EnergyCAP has a standard import file for meter data, so it’s easy to assimilate data from nearly any metering system. This data can be useful for detailed consumption analysis and bill verification.
Meter-Reading App
We’re currently developing a meter-reading app for mobile devices that will speed and streamline that labor-intensive process. Keep your eyes out for the official announcement.
And remember: don’t miss your meters. They’re working hard already–and with a little help from their friends, they can work even harder.
{{cta(’57e80222-d5f4-438b-b25b-9304bc82c49f’)}}
 Best-in-class portfolio-level energy and utility bill data management and reporting.
 Real-time energy and sustainability analytics for high-performance, net-zero buildings.
 A holistic view of financial-grade scope 1, 2, and 3 carbon emissions data across your entire business.
 Energy and sustainability benchmarking compliance software designed for utilities.


